We discussed the demography of Asians and Pacific Islanders last month, and demonstrated a wide range of diversity among Asians in America. Besides their fast-growing proportion as well as absolute numbers, they are so diverse that grouping them in a single word “Asian” and interpreting their characteristics as one group masks many disparities experienced by subgroups. For a long time, AANHPI then API (Asians and Pacific Islanders) have been grouped together for administrative convenience despite their being very diverse.
We will discuss the socio-economic diversity among Asian and Pacific islanders in this paper and document the variation within Asians that is far greater than variation between Asians and other ethnicities when Asians are clubbed as a single group.
Model Minority Myth: In the United States, “Asian Americans” are often held up as the “model minority”. They are a group considered rich, intelligent, successful as compared to white Americans or another ethnicity in general. For a moment, it may sound good, but this kind of grouping trivializes individual achievements and grossly misses great diversity, including wide variation of economic status, among Asians themselves. This denigrates Asians and other communities of color that do not fall into these categories and is dismissive of individual struggles and is an erasure of the historic institutional and structural barriers to success experienced by communities of color.
Educational Attainment: Asian Americans are often characterized by high levels of educational attainment. Many Asian ethnic groups have above-average rates of college and advanced degree attainment, contributing to their participation in skilled and professional occupations.
Occupational Distribution: Many Asian Americans work in professional, technical, and managerial positions. They are often overrepresented in fields such as technology, engineering, healthcare, and finance.
Income: On average, Asian Americans have had higher median household incomes compared to other racial or ethnic groups. However, there is significant variation among and within different Asian ethnicities, with some groups experiencing higher poverty rates or lower incomes.
Let us review these “model minority” myths with the facts.

Education Facts: While Indian and Chinese have almost three to four times higher percentage that white for having advanced degree (12.5% among Indians and 8.5% among Chinese as compared to 3% among Whites), this does not speak of all the Asians and Cambodian or Laotian who also are grouped in Asian have only 0.4% that is nearly 1/9th proportion as compared to Whites. This is because most of them arrived in the country as refugees and represent quite a different group educationally. On the other hand, because of restrictive immigration policies, many Indians immigrating to the US have only been granted entry because they fulfilled a temporary technical or professional quota, or as students. These immigration policies better explain the statistics than the discriminatory “model minority” myth. Pacific Islanders have only 1.6% reaching the advanced degree.
Education less than high school is 15.3% among White, it is comparable among Indians (12.6%) and Chinese (23.6%), but it is a whopping 53% among Cambodian, 38% among Vietnamese and thus Asians among themselves are very diverse. Labeling Asians as high educational achievers is not correct without looking into diversity among Asians. Pacific Islanders have a much higher percentage of 22% who have less than high school.
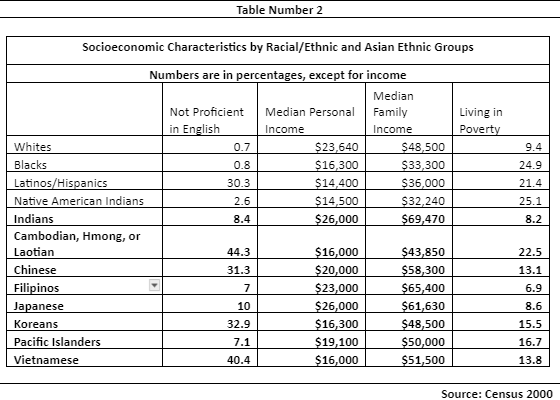
Occupation Facts: The model minority theory claims that Asians work in professional and technical fields. Table 2 shows that this is correct for Indians, Chinese and Filipino who have high skilled occupations at 52%, 42% and 30% respectively against 21% among White (See table 1), this is not true for other Asians and Pacific Islanders. Cambodians have only 9% in the highly skilled jobs, Pacific Islanders at 14%.
Income Facts: On average Asians have higher income than anyone else is the theory of model minority, let us review the facts. Nearly 9% of Whites live in poverty while data is comparable for Indians at 8%, Filipino at 7% and Chinese at 13%, but 23% Cambodians live in poverty, 16% Koreans live in poverty and 17% of Pacific Islanders live in poverty (See Table 2). You can see wide variation in income among Asian groups and generalization hides the extreme diversity observed in these groups. While these data are not very recent, the trend of the data is very evident.
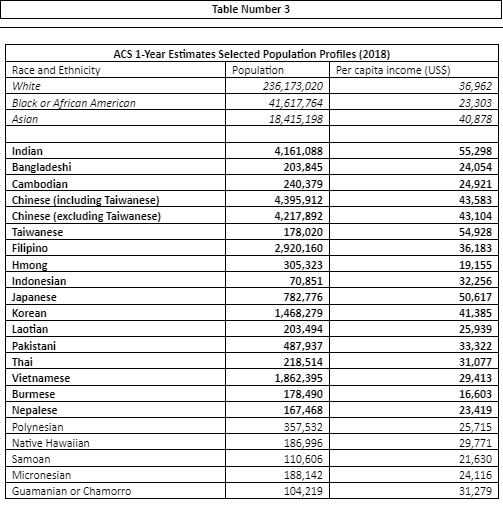
The recent data for income from American Community Survey 2018 1 are shown in table 3. The American Community Survey is done by the Census Bureau of the USA. In this survey, the nationwide population is 327,167,439 and the per capita income was US$33,831 in 2018
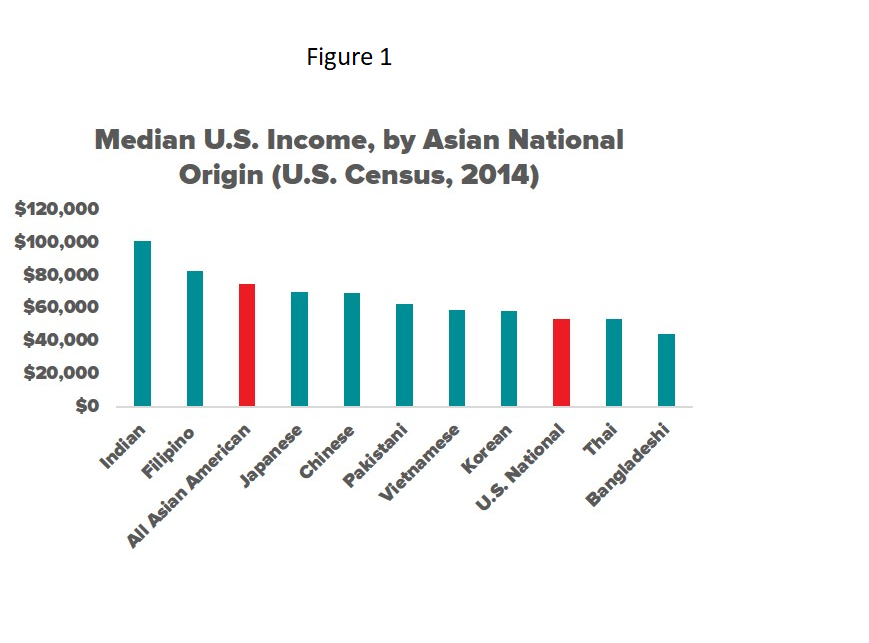
As noticed in the recent data of 2018 (table 3) average income per capita is higher in Asians than White or Black, when we review each ethnicity among Asian, it ranges from $16,600 among Burmese to $55,300 among Indians and clubbing them together will be a serious mistake. Similar differences are observed from other sets of data shown in figure 1.
Language Barriers: English Language Learners
While White and Black Americans speak English well and less than 1% are not proficient in English, the proportion is higher in all Asians with 44% among Cambodians, 40% among Vietnamese, 33% among Koreans and 31% among Chinese (See table 2). The lack of language access services provided by institutions that are considered social safety nets hinders them from being able to receive the same opportunities as every other American.
To Summarize, generalizing Asians as Model Minority is technically incorrect and comparing Asians against other ethnicities as a single group is like comparing oranges with apples. Above data clearly differentiated the diversity within Asians. Let me point out at this stage that Asians include 27 different countries and ethnicities, and we have for the convenience and for the paucity of the available data, just used nearly half of them to discuss the details here and further disaggregated data will reveal further differences.
Next month we will see the differences in the health status among Asians as against the others and will also see the differences among different ethnicities among Asians.
At Asian Pacific Community in Action, we strive to make this distinction loud and clear by doing community-based research in the state of Arizona to document these differences. We then, by partnering with other agencies, present them to appropriate authorities including the Government to not only ensure that they acknowledge these differences but also to ensure that resources and facilities are provided appropriately. It is important for the entire API community to participate in efforts to survey our community so that governmental authorities get a more representative picture of us and our families’ needs. APCA also hosts Health Fairs and other events on an ongoing basis, to find the latest event, please go to: https://www.apcaaz.org/events/