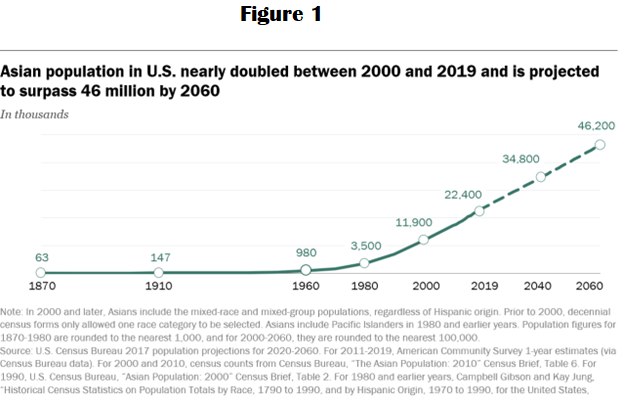
In 2020, Americans who identified as Asian alone (19,886,049) or in combination with other races (4,114,949) totaling to 24 million and made up 7.2% of the U.S. population. This is projected to be 46 million by 2060 and will account for 10% of the US population. As compared to 1910, the present Asian Population has grown 150 times more (See fig 1). They are about 31% of the total immigrants in the USA.
However, Asians are a highly diverse group of people. As of 2022, Chinese, Indian, and Filipino Americans make up the largest share of the Asian American population with 5.2 million, 4.8 million, and 4.4 million people respectively. These numbers equal 22%, 20%, and 18% of the total Asian American population, or 1.6%, 1.4% and 1.3% of the total U.S. population. A total of 27 different countries of Asia are presented in the USA, all of them with unique histories, cultures, languages, and other characteristics.
Historical Perspective
In 1980 and before, census forms listed Asian ancestries as separate groups, along with white and black Asian Americans had also been classified as “other”. In 1977, the federal Office of Management and Budget issued a directive requiring government agencies to maintain statistics on racial groups, including on “Asian or Pacific Islander”. By the 1990 census, “Asian or Pacific Islander (API)” was included as an explicit category, although respondents had to select one ancestry as a subcategory. Beginning with the 2000 census, two separate categories were used: “Asian American” and “Native Hawaiian and Other Pacific Islander.”
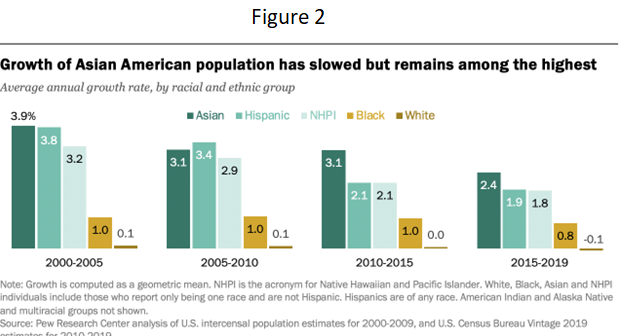
Growth of Asian Population is the highest currently in the country:
Since 2000, the Asian population has been growing fast in the country compared to any other group. There is a slight decline in the percentage of growth among all the races including Asians, however Asians remain at the top of the list, followed by Hispanic, Native Hawaiians and Pacific Islander (NHPI), black and then white (See figure 2). White population is stable. In Arizona and Nevada, Asians are fastest growing. Arizona has relatively less population than the national average while Nevada has higher proportion of Asians compared to national average.
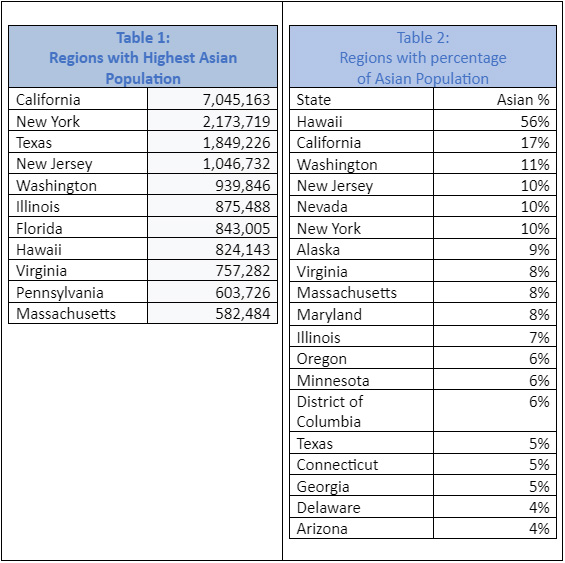
Geographic Variation among Asians in the USA:
Largest number of Asians are in California, followed by New York, Texas, and New Jersey. Top eleven states are listed in Table 1 with their Asian population size.
However, when we look at the percentage of Asians among states, Hawaii has the highest relative population of Asian Americans, with a total of 547,843 Asian Americans, accounting for 38.95% of the total population. Honolulu County has the highest percentage of Asian Americans of any county in the U.S. at 62%. There has been a recent increase in the immigration of more ethnic Asian groups such as the Thai, Indonesian and Vietnamese people. Relative proportion of Asians among states is shown in table 2.
Wyoming has 4,633 Asian Americans, making it the state with the smallest population of the demographic. West Virginia has the smallest relative population of Asian Americans, with a total of 14,311 making up only 0.81% of the state’s total population.
Religious Affiliation of Asians in America:
The largest group of religion followed among Asians in America are Christians (42%), followed by unaffiliated (26%), Buddhist (14%), Hindu (10%), Muslims (4%) and Sikh (1%). Other 2% include Jain, Zoroastrian, Tengrism, Shinto and Chinese folk region, Vietnamese folk religion etc.
Language Diversity and Proficiency among Asians in the USA
There is language diversity among Asian immigrants living in the U.S. The vast majority (86%) of Asian immigrants 5 and older say they speak a language other than English at home, while 14% say they speak only English in their homes. The most spoken non-English language among Asian immigrants is Chinese, including Mandarin and Cantonese (20%). Hindi (18%) is the second most spoken non-English language among Asian immigrants.
About half (47%) of Asian immigrants ages 5 and older who have been in the U.S. for five years or less say they speak English less proficiently, according to a Pew Research Center analysis of Census Bureau data and this can have large implication for the services that they can avail and other opportunities for the job and health care.
Asians in Arizona
According to the most recent American Community Survey, the Asian population in Arizona is 226,597 – at 3.2% of the total population of Arizona. Most Asians of Arizona are living in Metro Phoenix, Maricopa County and the city with the highest Asian population is Chandler (10.65%), followed by Tempe (8.8%) and Gilbert (5.6%).
Concluding Remarks: Asians in America are a fast growing resilient population, contributing to changing demography of the country and need their special positions and attention from the Government and other Social Services for the weaker and vulnerable sections to ensure they get and utilize their privileges and services adequately.
We will explore Asians in America from Socio-economic perspective, education, health status and health disparity etc. in the future papers.
At Asian Pacific Community in Action, we strive to ensure that Asians and Pacific Islanders get their due share of rights, education, health care and other social benefits due to them. We do this through research, programs, and advocacy with the Government.